These graphics reflect the state of the maps when I finished the City of Pittsburgh. I'm running beyond the city limits now but I have to update the old programs that generated these before including them here! — Tom 7, 31 Dec 2022
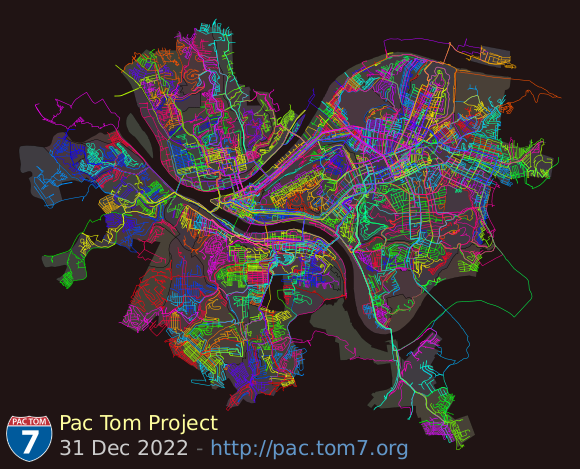
map.pdf (1.6M)
This is a map automatically generated from all the routes I've taken, as well as annotations that I've put on the map. It's a PDF file so that you can zoom as much as you want; it's too much to fit on one screen. I collect annotations as I go but those aren't rendered yet. It's a little tricky.
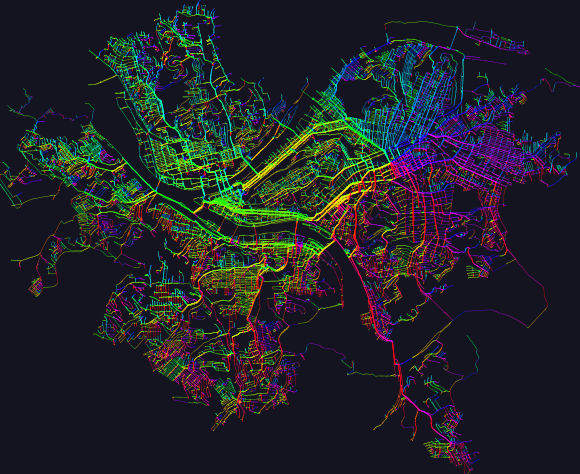
shortest.pdf (5.8M)
This map shows the shortest route to my house from any place I've been. Of course the shortest way would be a straight line (great circle) but I can't just run over houses and rivers, so I use the places I've been as potential paths. The more I run, the more accurate the shortest paths get. In order to emphasize the points at which the shortest path differs (for example, a spot where running west on the road leads to the shortest way home, but if I were one meter to the right, east would be the fastest), each segment is colored according to the angle at which I'd be running to go towards home. If you see the color change abruptly along a street, then that's the farthest away I can get from my house on that street segment. More info.
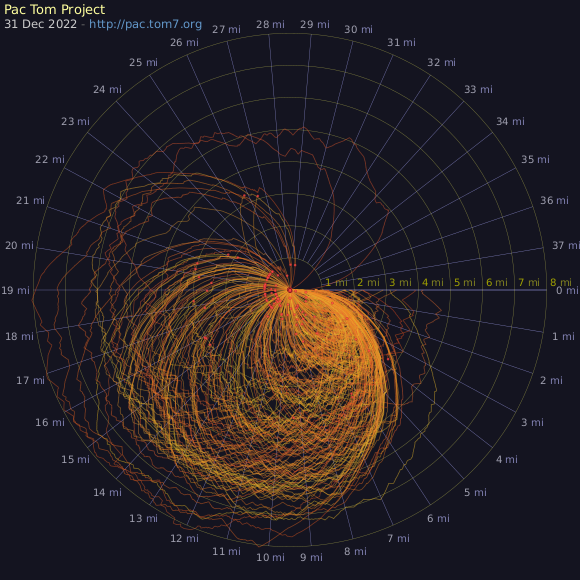
radial.pdf (3.1M)
This plot shows my absolute distance from home versus distance traveled on the trip. Each one of the orange lines is a Pac Tom running trip. The squiggles always start at angle 0, corresponding to 0 miles. They proceed around the radar circle clockwise according to how many Tom-sneaker miles the trip is, with a full revolution being 35 miles. At every point their distance from the center is based on the number of crow-flying miles that I am away from my home, with the outermost circle being 8 miles. Red dot emphasizes the end point. More info.

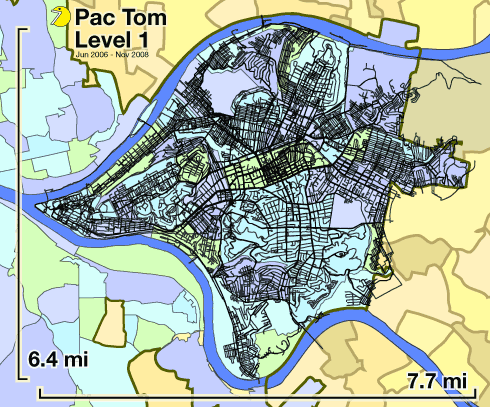
level 1 trophy.pdf (1.9M)
This map commemorates the completion of Level 1, which is the part of the city between the Allegheny and Monongahela rivers. I call it "continental Pittsburgh". It's less than half of the area of the city at 23.5 square miles, and it's easier than Level 2 for two reasons: I live almost the center of it (so it's easier to reach on foot than stuff over the rivers) and it's less hilly (but that's not saying much). It's still really hilly and thousands of miles of running, so that's why I get a trophy for finishing it, which I did on 18 November 2008.
I also completed Level II on 29 October 2022, which is commemorated with this elaborate video consisting of over 111,000 images.